
- Academic Editor
†These authors contributed equally.
Background: In our modern world we are exposed to a steady stream of information containing important as well as irrelevant information. Therefore, our brains have to constantly select relevant over distracting items and further process the selected information. Whereas there is good evidence that even in rapid serial streams of presented information relevant targets can be actively selected, it is less clear whether and how distracting information is de-selected and suppressed in such scenarios. Methods: To address this issue we recorded electroencephalographic activity during a rapid serial visual presentation paradigm in which healthy, young human volunteers had to encode visual targets into short-term memory while salient visual distractors and neutral filler items needed to be ignored. Event-related potentials were analyzed in 3D source space and compared between stimulus types. Results: A negative wave between around 170 and 230 ms after stimulus onset resembling the N2pc component was identified that dissociated between target stimuli and distractors as well as filler items. This wave appears to reflect target selection processes. However, there was no electrophysiological signature identified that would indicate an active distractor suppression mechanism. Conclusions: The obtained results suggest that unlike in situations where target stimuli and distractors are presented simultaneously, targets can be selected without the need for active suppression of distracting information in serial presentations with a clear and regular temporal structure. It is assumed that temporal expectation supports efficient target selection by the brain.
The human brain constantly has to select relevant over irrelevant information. For visual attention such selection processes are of uttermost importance [1, 2, 3], implemented via top-down control in visual search, for instance [4]. It has been suggested that this is achieved by applying so called activation maps [4]. However, frequently, salience of visual information determines which stimuli are selected for further processes [3]. And this selection does not necessarily have to be voluntarily. The dimension-weighting account proposes that feature maps can be influenced by previous experience and pre-attentive processes - amplifying and down-regulating the processing of different kind of information in parallel [5, 6]. This way not only selection of target stimuli but also suppression of distractors can be achieved [6, 7].
Suppression of salient distractors that co-occur with visual target stimuli
seems effortful, requiring an active inhibition process that can be quantified
using the so-called distractor positivity component P
The N2pc and P
Sequential presentation of targets and distractors implicate that in addition to features such as spatial location, color, shape, salience, etc., temporal information might be used in processing and dissociating targets from distractors. It has been shown that visuospatial and temporal attention can go hand in hand, and thus, support attentional processing of incoming sensory information [19]. Recently, it was reported that temporal predictability can even protect information stored in working memory from distraction [20, 21].
This is why we ran a delayed match-to-sample task in which in the encoding phase of each trial a series of rapidly highlighted spatial positions in a square matrix was presented to typically developed young human volunteers while EEG was recorded from the scalp. The rapid serial visual presentation mainly consisted of “filler items”, i.e., positions highlighted in gray, which the volunteers were supposed to ignore. Within each trial there were, however, five positions that were highlighted in green (“targets”) and three positions highlighted in red (“distractors”). Participants had to retain the target positions and later compare (match) them to a probe with five positions marked in green. The red “distractors” were highly salient [22, 23] but should be ignored by the volunteers. Importantly, the temporal structure of trials was always the same so that participants could potentially use temporal predictability of distractor occurrence as a mechanism to efficiently filter out distracting information.
We analyzed ERPs for the three stimulus categories (targets, distractors,
fillers) in source space and hypothesized that a negative deflection around 250
ms after stimulus onset similar to the N2pc (or the non-lateralized N2pcb [13])
should be pronounced for targets compared to distractors and filler items.
Encoding of targets into short-term memory in rapid serial presentations should,
moreover, elicit a stronger P300-like ERP component in targets compared to
distractors and filler items. As a signature of active distractor suppression we
also expected a positive going wave around 200 ms after stimulus onset similar to
the P
23 young healthy volunteers participated in the study at the LMU Munich, faculty 11 (where data were recorded; approval number: 18-2015-Sauseng-a), after giving written informed consent. Due to EEG recording malfunctions data from two participants could not be used for data analysis. The remaining sample of 21 volunteers had a mean age of 21.2 years (standard error of the mean (SEM) = 0.62) and consisted of 13 female and 8 male participants. They were all right-handed. A 12 plate Ishihara Test was used to confirm that no participant was color blind. The study was approved by the ethics review board at LMU Munich, faculty 11 (where data were recorded; approval number: 18-2015-Sauseng-a) and conducted according to the Declaration of Helsinki. All participants gave written informed consent and voluntarily took part in the experiment.
A visual delayed match-to-sample paradigm (Fig. 1) was run in which in each of
200 trials a rapid serial visual presentation was shown during an encoding phase.
The monitor at which the paradigm was presented had a refresh rate of 60 Hz. At a
rate of 6 Hz individual positions in a 5
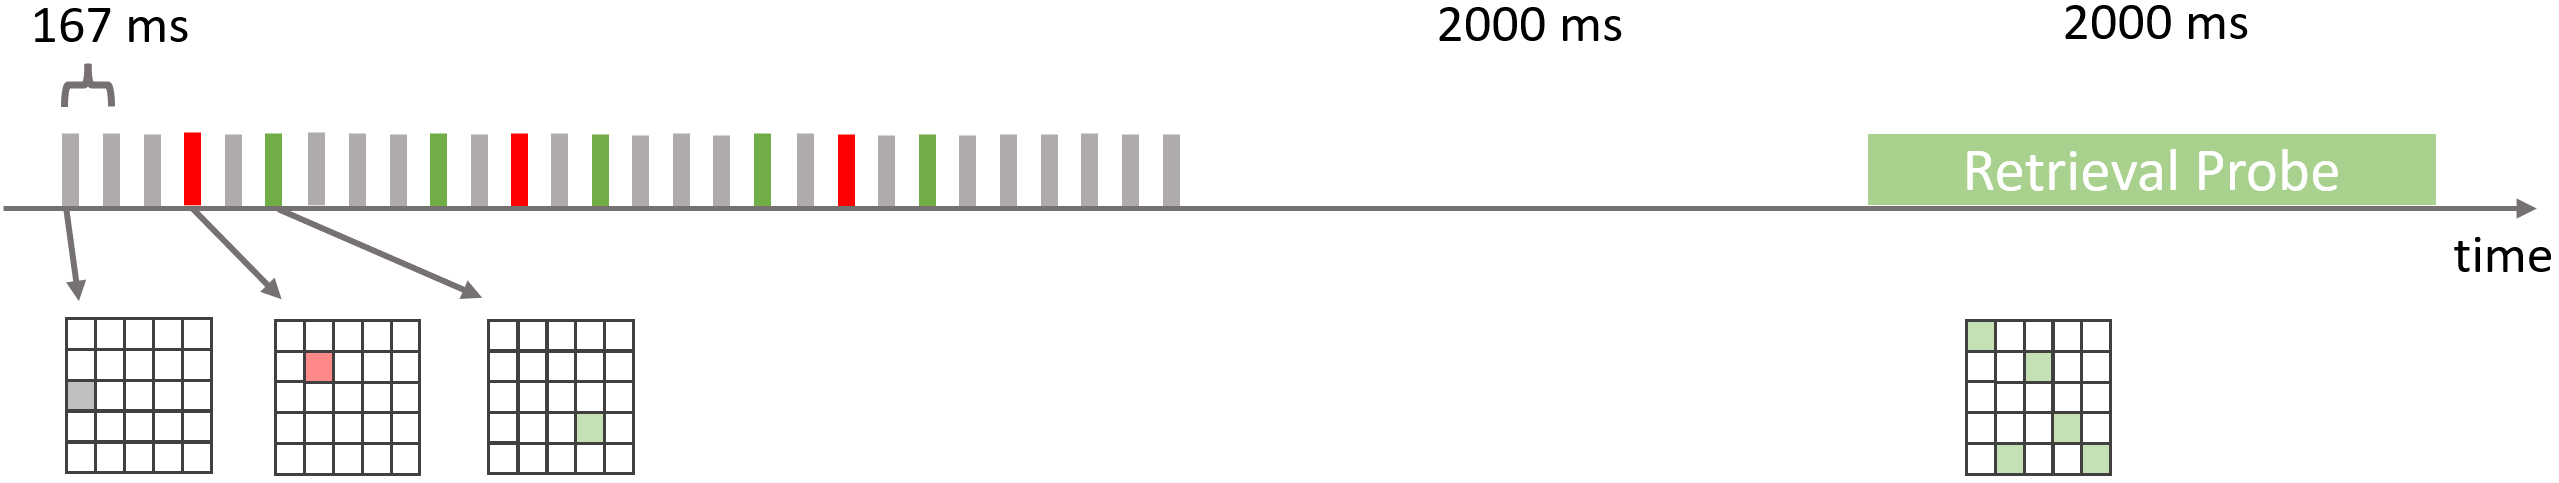 Fig. 1.
Experimental Paradigm. In each trial of this delayed match-to-sample task a rapid serial visual presentation constituted the encoding phase. Spatial positions in a square matrix were sequentially highlighted at a rate of 6 Hz (stimulus onset asynchrony of roughly 167 ms). The majority of stimuli were gray filler items. Five of the frames (highlighted in green) were targets that had to be selected and encoded in short-term memory in order to compare their positions to a retrieval probe. Three stimulation frames in the rapid serial visual presentation stream were salient (red) distractors.
The temporal structure of the rapid serial visual presentation stream was identical in each trial. General presentation rate was 6 Hz. Targets were presented at a rate of 1.5 Hz. Distractor presentation rate was 0.75 Hz.
Scalp EEG was recorded from 60 channels placed according to the 10-10-system using Ag-AgCl ring electrodes and a BrainAmp 64 channel amplifier (BrainProducts®, Gilching, Germany). Additionally, signals from the left and right mastoids and horizontal and vertical electrooculogram (EOG) were recorded. Data were sampled at a rate of 1000 Hz. Impedances were kept below 10 kOhm during data recording.
For each participant false alarm rate was subtracted from the hit rate and
multiplied by the number of to-be retained items (five in this case) as an
estimate of short-term memory capacity K [24]. If a participant performed
perfectly on the task K would equal 5. If a participant performed on chance level
their K value would equal 0 ((0.5 false alarm rate – 0.5 hit rate)
EEG analysis was carried out using BESA 7.1 software (BESA®, Gräfelfing, Germany). First, a 50 Hz notch filter was applied followed by a multiple source approach for EOG artifact correction [25] as implemented in BESA 7.1 whenever horizontal EOG signal was larger than 150 µV or vertical EOG was larger than 250 µV in amplitude. Using this EOG source based artifact correction [25] subsequently analyzed ERPs should not contain any effects resulting from eye movements. EEG artifacts were automatically marked and excluded from further analysis when after correction the signal at any EEG channel was exceeding 120 µV in amplitude or if it was constantly below 0.01 µV, as well as if the signal gradient exceeded 75 µV. Thereafter, EEG data were zero-phase shift filtered between 0.1 Hz (slope of 12 dB/oct) and 30 Hz (slope of 24 dB/oct). For each participant segments of –200 ms to 500 ms around stimulus onset were epoched for targets, distractors and filler items. These segments were then averaged into ERPs for each participant separately for the three stimulus categories. On average 921 (SEM = 35.5) segments were used per participant for the target ERP, 546 (SEM = 21.0) for distractors and 3449 (SEM = 132.7) segments for the filler ERPs. The large number of trials even in the distractor condition should have reduced the noise level to an extend that unequal trial numbers across conditions are considered as negligible factor.
To get rid of volume conduction effects that can lead to spurious results on scalp level, ERPs were analyzed in 3D source space next. Note that we were mainly interested in the temporal evolution of the ERP signal and not so much in spatial information obtained from the EEG. Therefore, the topographic source of any effects obtained will not be interpreted—the sole purpose of EEG source reconstruction in this study was to (i) limit volume conduction effects, (ii) reduce the number of measurements (60 EEG scalp electrode sites to a couple of dipole locations). Grand average ERPs were calculated (individual ERPs averaged across participants for each stimulus category separately). Next the target grand average ERP was submitted to standardized low-resolution electromagnetic tomography (sLORETA) [26] as implemented in BESA 7.1 software. BESA 7.1 identified two local sLORETA maxima. Thus, two dipoles were set into these local activity maxima. Orientation of the two dipoles was then fit to explain maximal spatial variance of the grand average ERP scalp topography. The resulting two-dipole montage explained a maximum of 97.1% of spatial variance in the target grand average ERP. The same procedure was applied to distractor and filler grand average ERPs. A two-dipole solution explained 89.7% of topographic variance in the distractor grand average scalp ERP. The filler ERP was best explained by a four-dipole solution. Still, only 64.3% of scalp topographic variance could be explained using this source montage.
The target source montage was then applied to target, distractor and filler ERPs for each participant separately. This way individual ERPs were obtained for each of the (two) dipole sources. Using the BESA statistics 2.1 package (BESA®, Gräfelfing, Germany), cluster-based permutation analysis of variance (ANOVA) tests [27] were run comparing target, distractor and filler ERPs obtained with the target source montage. In 1000 permutations a cluster alpha of 0.001 was used to identify temporal clusters between 0 and 500 ms after stimulus onset in which the three experimental conditions differed significantly. This was followed-up with cluster-based permutation post-hoc t-tests comparing the conditions in a pair-wise manner (i.e., target vs. distractor, target vs. filler, distractor vs. filler). The identical statistical analysis approach was then used on source ERPs obtained by applying the distractor (two-) dipole source montage and the filler (four-) dipole source montage to all three experimental conditions. This was done to make sure that also distractor and filler-related activities were optimally captured in at least one of the analyses. It was, however, not possible to directly compare data from the target montage, distractor montage and filler montage, since they comprised different locations and numbers of dipole sources.
As an exploratory analysis behavioral parameters (i.e., individual K values) were correlated with target and distractor source ERPs, again using a cluster-based permutation testing approach as implemented in BESA statistics 2.1.
For completeness, ERPs were also analyzed on scalp level. For each participant ERPs for targets, distractors and filler items were calculated. Similar to statistical analysis on source level we used BESA statistics 2.1 package to run cluster-based permutation ANOVA tests [27] comparing target, distractor and filler ERPs. In 1000 permutations a cluster alpha of 0.001 was used to identify clusters over time and electrode positions between 0 and 500 ms after stimulus onset in which the three experimental conditions differed significantly. This was followed-up with cluster-based permutation post-hoc t-tests comparing the conditions in a pair-wise manner (i.e., target vs. distractor, target vs. filler, distractor vs. filler).
The temporal sequence of target, distractor and filler presentation was identical across trials. This bears the problem that the second and third distractor followed target presentations (with always one filler in-between), whereas the first distractor was not preceded by a target. Hence, there is the possibility that the second and third distractors did not need to be actively suppressed as they exactly fell into potential attentional blinks [15] resulting from the preceding targets. To control for that, distractor-related ERPs for the first, second and third distractor presentation were compared on scalp level. Again, cluster-based permutation ANOVA tests [27] were run, this time comparing the three distractor positions.
Average memory capacity K in the current task was 2.41 (SEM = 0.26) indicating that on average participants performed well within a margin clearly above chance level as well as below ceiling.
After applying the source montage derived from target ERPs to all three
conditions, cluster-based permutation ANOVA tests over time identified only one
single cluster with a significant difference between the three experimental
conditions. This cluster was obtained for the more medial of the two dipole
sources (see Fig. 2A) and stretched over the time interval between 172 to 223 ms
after stimulus onset (maximal F-value = 72.6; all Fs
 Fig. 2.
ERP results on source level. When the source montage derived from target ERPs was applied to all three stimulus conditions (A) one cluster (at the dipole source marked in blue) stretching between 172 and 223 ms after stimulus onset dissociated between targets and distractors/fillers. Note, there was no significant difference between distractors and filler items. Largely identical results were obtained when a source montage based on distractor ERPs (B) or filler ERPs (C) was applied to all the conditions. There was always only one significant cluster identified dissociating between the three stimulus categories (driven by a larger negative wave for targets); and the cluster always stretched over an interval from roughly 170 to close to 230 ms. In none of these cases there was any significant difference between distractors and fillers. Colored dots (blue, red, pink or green) represent the locations of dipole sources (SDs). The dipole sources displaying significant differences between conditions (as indicated by pink shading in the amplitude and F-value graphs) are marked by a circle around the dot (i.e. in A the red dipole source would be SD-1, the blue dipole source is SD-2. The same accounts for B and C.). ERP, event-related potential; L, left; R, right; A, anterior; P, posterior.
Very similar results were found when the source montage obtained from
distractors (see Fig. 2B) and that from filler items (see Fig. 2C) were applied
to the ERP data. Using the distractor montage, again, only one significant
cluster was observed at which the three experimental conditions differed
significantly (173 to 223 ms; maximal F-value = 60.3; all Fs
A comparison between targets, distractors and fillers was also run on EEG scalp
level. Similar to source level there was one significant cluster stretching
between 165 and 230 ms after stimulus onset dissociating between the conditions
(maximal F-value = 37.8; all Fs
 Fig. 3.
ERP results on scalp level. Comparing targets, distractors and
filler items on scalp level revealed one significant (p
The temporal structure of trials led to the fact that the second and third
distractors were preceded by targets, whereas this was not the case for the first
distractor. If, therefore, attentional blinks following targets made it
unnecessary to actively inhibit distractors, we should find a significant ERP
difference between the first (that was not preceded by a target) versus the
second and third distractor in each trial. Cluster-based permutation ANOVA
comparing first, second and third distractors on the scalp level revealed a
significant (p
Exploratory cluster-based permutation Pearson’s correlations between ERP
amplitude in source space (using the target source montages for all ERPs) and
individual K-values were run. The expectation was that the target-related
negative wave should correlate negatively with short-term memory capacity
(stronger negative wave associated with higher [positive] K-values), whereas this
correlation should be in the opposite direction for distractor-related negative
waves. However, no single significant cluster was obtained indicating no
correlation between K-values and any of the ERP amplitudes (all
Similar as in experimental paradigms in which targets and distractors are
presented simultaneously, we had expected that also during rapid serial visual
presentation targets would elicit a stronger negative going wave around 200 ms
after stimulus onset. Distractors had been expected to show a P
Our results suggest that during rapid serial visual presentation of targets and
distractors the brain actively selects targets for further processing (e.g.,
storage into short-term memory) while distractors seem ignored by simply not
selecting them. Since even before the start of each single trial, participants in
the current study had already known exactly which items were targets (namely the
green squares) they were able to tune their attentional filter towards the
relevant features—making the selection process the relevant operation to solve
the current task. In attentional blink paradigms [15] it is also argued that
attentional filters are tuned towards identification of the first of two targets
[28, 29]. Without any effort this target can then be identified within a series of
similar distractors (e.g., within a stream of letters presented sequentially).
Parallel presentation of targets and distractors simultaneously as in paradigms
in which P
In a recent study by Forschack et al. [32] lateralized targets and distractors were presented simultaneously; but stimulus locations were tagged at different frequencies so that steady-state evoked potentials could be obtained. Whereas steady-state evoked potential amplitude increase was observed at target locations, there was no amplitude attenuation at distractor locations; i.e., similar to our current main findings there was no evidence for active distractor suppression. In Forschack et al.’s study [32] only one target location and one distractor location was shown. Therefore, it was argued that most likely in small set-size search display, initially, targets as well as distractors capture attention; and in a second stage targets are selected by amplification of their neural response [32].
While set size was larger in the current study, only one feature, i.e., color, dissociated targets from distractors and filler items. However, the reason why in the current design no active distractor suppression mechanism was obtained might also have to do with the temporal structure of trials. The sequence of stimuli was identical across trials with a fixed frequency at which targets, distractors and filler items were presented. Therefore, temporal expectations may have supported efficient selection and processing of targets [19] making it unnecessary to actively suppress distractors. And indeed it is known from working memory paradigms that temporal predictivity can support shielding memory content from distraction [20, 21]. A similar beneficial effect of temporal predictivity seems very plausible in the current task where participants acquired information about the exact timing of distractor appearance.
In the current study participants were not only required to select targets among distractors and fillers, but they were also asked to store targets in short-term memory and compare them to a probe after a short delay interval. In rapid serial visual presentation studies encoding of targets has frequently been associated with a P300-like positive wave in ERPs (e.g., [17, 18]). We did not find such deflection dissociating between targets and distractors or filler items in our study. Moreover, the ERP effects in the current experiment did not correlate with short-term memory task performance. This supports the notion that the negative N2pc-like wave here does indeed merely reflect selection of targets without encoding into short-term memory. Moreover, a lateralized slow negative wave, the contralateral delay activity (CDA), is more frequently been associated with short-term memory capacity rather than earlier ERP components [33, 34]. The rapid serial presentation in the current study, however, might not be optimal for detecting such slow negative waves. Encoding and maintenance of targets in rapid serial visual presentation might rely on more distributed processes that cannot be easily captured by activity from a single cortical source. Glennon and co-workers [28], for instance, were able to demonstrate that in an attentional blink paradigm encoding and maintenance of targets depended on coherent, rhythmical activity at theta frequency within a left and medial to right temporo-parietal cortical network. Since in the current study dipole analysis was purely data driven it was not possible to investigate for instance fronto-parietal interactions. It should also be noted that 3D source analysis here was merely used for reducing volume conduction effects, reducing number of sites and increasing the signal to noise ratio. The purpose of source analysis in the current study never was to investigate where in the brain targets are selected and processed; the aim was to investigate the temporal evolution of the process and to investigate if and when distractors get dissociated from targets; 3D source analysis was merely applied as a method by which information from all scalp recording channels was used for obtaining temporal neural information. This is also why we do not interpret the location of identified dipole sources in the brain.
Comparison between targets, distractors and filler items was also run on scalp level. These results (Fig. 3) resemble those from the 3D source analysis very well. The spatial extend of the effect is large, covering all occipital, parietal and temporal scalp recording sites. As in the source analysis there was an N2pcb-like negative wave that dissociated targets from distractors and fillers in the absence of any significant difference between distractors and filler items. Same as in source space, no additional potential distractor suppression-related effect was found on scalp level.
In each trial the second and third distractor in the sequence were always preceded by presentation of a target by 334 ms. Thus, these distractors fell into the time window where after a target presentation the attentional blink could be expected [15]. This could potentially explain why no active distractor suppression was necessary in the current task. However, a comparison between ERPs to the first, second and third distractor presentation separately only indicates a deviation of the second distractor throughout most of the analysis time window (speaking for a rather unspecific effect which might be caused by a baseline shift). There was no significant difference between the first and the third distractor. This makes it rather unlikely that the attentional blink was responsible for distractor suppression in the current task.
Another potential explanation for the lack of any distractor suppression-related
ERP signature in the current data set could be that distractors might not have
been salient enough. Color, however, is a feature of great importance when it
comes to salience of stimuli, particularly distractors [22, 23, 35]. Targets and
distractors colored in red (as compared to green) among grey stimuli captured
attention most strongly in a visual search task despite matched luminance—an
effect also reflected by N2pc and P
Whereas in experiments where targets and distractors are presented simultaneously separate ERP signatures of target selection and distractor suppression have been reported, here we do not find any ERP phenomenon associated with active distractor suppression. A negative wave between around 170 and 230 ms after stimulus onset as a clear signature for target selection was obtained however. Most likely the fast serial presentation of targets and distractors and temporal predictability allowed the brain to efficiently tune attention filters making it unnecessary to actively suppress distractors.
EEG, electroencephalogram; EOG, electrooculogram; ERP, event-related potential.
EEG data and behavioural data are fully available at Open Science Framework (https://osf.io/6te9a/?view_only=43deb01766c84f83a6f582174c6d15ab).
PS and MG conceptualized and implemented the study. MG recorded data. CP and PS analyzed data. All authors contributed to editorial changes in the manuscript. All authors read and approved the final manuscript. All authors have participated sufficiently in the work and agreed to be accountable for all aspects of the work.
The study was approved by the ethics review board at LMU Munich, faculty 11 (where data were recorded; approval number: 18-2015-Sauseng-a) and conducted according to the Declaration of Helsinki. All participants gave written informed consent and voluntarily took part in the experiment.
Not applicable.
This research received no external funding.
The authors declare no conflict of interest.
Publisher’s Note: IMR Press stays neutral with regard to jurisdictional claims in published maps and institutional affiliations.